For the Bahamas, Eastern and Central Cuba, as well as South Florida, this wave brings the potential for heavy rain.
The view from Space

The disturbance itself is sitting over the Turks and Caicos islands.
The blues and greens represent light rainfall, the yellows and oranges indicate moderate rain, while heavy downpours show up as reds and blacks.
The wave is highly disorganized but it is holding plenty of tropical moisture.
Sunday's Forecast Map
There are many things to look at on this map. You will notice horizontal lines with numbers such as 16, 18, & 20. These represent the weight of air or pressure. The lower the number, the lower the pressure, the higher the number, the higher the pressure. The vertical line over Central Cuba is the wave. High pressure tends to have winds blowing in a clockwise fashion so this places the wave on a northwesterly track aiming for South Florida.
The precise timing and how much rain it will drop is still uncertain, but models are suggesting a Sunday afternoon start with the possibility of heavy rain through Tuesday. If the wetter scenario takes place, there may be many areas seeing localized street flooding.
The latest from the National Hurricane Center
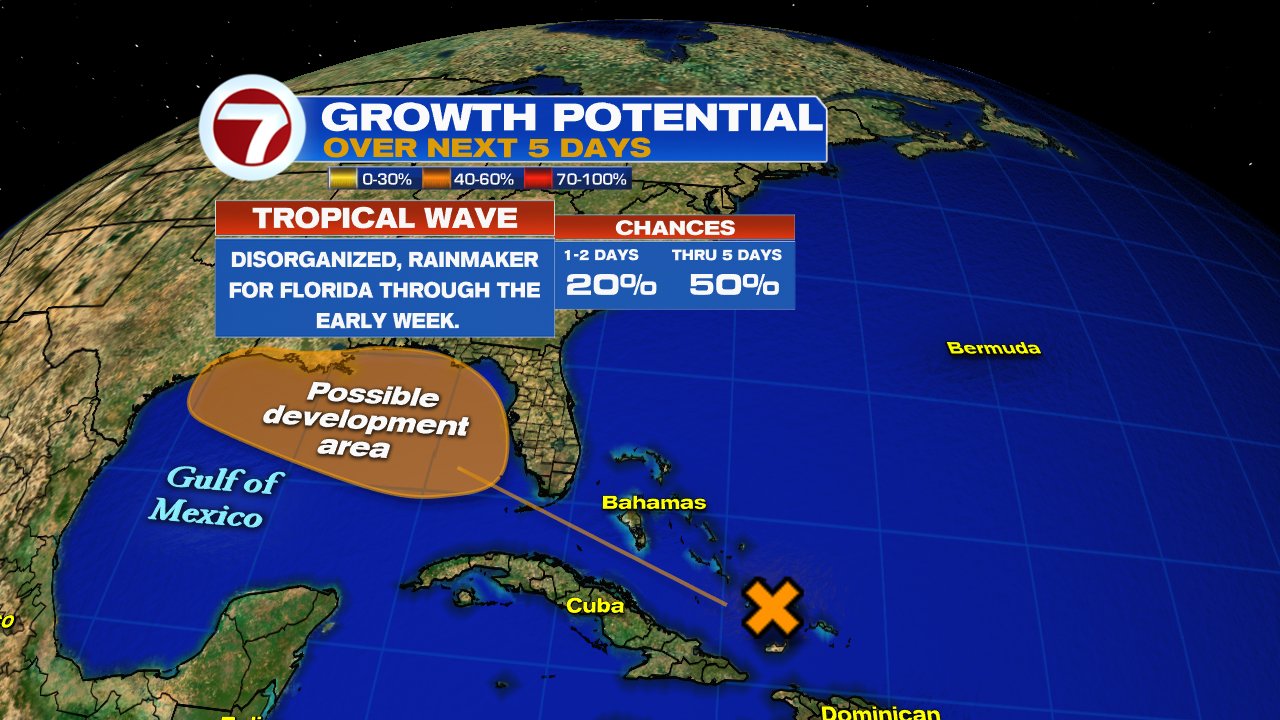
As mentioned in previous posts, the wave is surrounded by strong shear. This is preventing the wave from developing into a depression or a tropical storm. This should be the case until it moves into the Gulf of Mexico, by then the shear relaxes and gives it room to grow. So much so that NHC, has upped the formation chances from 20% to 50% as of 8pm Saturday night. They think if it's going to develop it will do so in the area highlighted in orange over the next 5 days. A recon mission may be sent on Monday to investigate the disturbance.
What Next?
Some of the extremely early model runs are suggesting the possibility of a system developing in the Gulf and aiming for Coastal Louisiana. Caution: Since nothing has developed, there is no good starting point for the models to use, therefore, the ending spot is an educated guess.
Notice the three models: GFS, EURO, and CMC. What we are looking for here, are tight green spirals. These represent tropical systems like storms and hurricanes. You can clearly see the activity in the Pacific as well as Florence in the Mid Atlantic. (NO THREAT to So Florida).


The European model places a similar green swirl near Louisiana in about the same time frame.

The CMC model has the tightest, possibly stronger outcome, a little farther west along the Texas, Louisiana border.
The Gulf States will be on the lookout for this wave once it enters the Gulf of Mexico by Tuesday.
We'll be watching.
No comments:
Post a Comment