The week-long hurricane conference held in Atlanta this year has come to an end. It was nice to run into some old friends and fellow meteorologists like Brian Norcross, now at the Weather Channel, Dr. Richard Knabb, formerly of NHC and now also with the Weather Channel, and former NBC6 and PLG 10 meteorologist John Gerard, now working in San Antonio. Hurricane guru Bill Gray was there as was former NHC director Max Mayfield. It was great to be surrounded by great minds and I made the best of it soaking up all the wisdom they offered.
Many things were discussed during the conference, from improving hurricane forecasting, to better communication of important information. Here is a summary of the conference:
Behind the scenes :
A clearer "Storm Status" identification will be issued for each advisory. In the past, even if a hurricane had downgraded to a tropical storm, the advisory would still say "Hurricane Name" and then in the following text it would say,"has been downgraded." Starting in May, all advisories will give the exact status of the system. Not a biggie, but very important when one is tracking multiple storms.
New this year, all The Tropical Cyclone Discussions will include both km/ and mph conversions. This is normally not a big issue until you've been on the air for 19 hours straight.
NHC is now offering a pronunciation guide for Storm Names. Remember Noel? Or was it No-el? Well NHC has eliminated the confusion by providing a list of the correct pronunciations. Here is this year's list.
2011
Arlene ar-LEEN
Bret bret
Cindy SIN-dee
Don dahn
Emily EH-mih-lee
Franklin FRANK-lin
Gert gert
Harvey HAR-vee
Irene eye-REEN
Jose ho-ZAY
Katia ka-TEE-ah
Lee lee
Maria muh-REE-uh
Nate nait
Ophelia o-FEEL-ya
Philippe fee-LEEP
Rina REE-nuh
Sean shawn
Tammy TAM-ee
Vince vinss
Whitney WHIT-nee
Important information:
Nothing causes more damage in hurricanes than the storm surge. In the past, storm surge height was tied into the Saffir Simpson wind scale but this had a huge inherited problem... no coastline is identical. A cat 3 storm surge will be different in Miami as compared to New Orleans. Over the past few years NHC has been working on how to present the risk of storm surge to your coastal community.
Storm Surge Exceedance products will become operational this year. The exceedance graphics show the storm surge height, in feet above normal tide level, which has a specific probability of being exceeded in the next 3 days. The available probability thresholds range from 10 to 90 percent, at 10 percent intervals.
The cone is shrinking!
Due to the great work the forecasters have accomplished over the years... the forecast swath will be smaller. Forecasters tell me that since 1990 track errors have decreased by 60%. With this impressive stat, they are now reducing the dreaded cone.
At 12 hours out there is no change from before, but at 24 hours, the cone will be reduced by 59 nm, at 36 hours by 79 nm, at 48 hours by 98 nm , at 72 hours by 144 nm, at 96 hours narrowed by 190 nm, at 120 hours down to 239 nm. Keep this in mind, even though this is an enormous leap forward there is still risk.
Experts tell me that no forecast is ever perfect. Even today, track errors may be as large as 40-50 miles per day and with huge gaps in data out in the Atlantic it is a bit more difficult to gain full understanding of any system. As a matter of fact forecasters expect storms to go out of their forecast path a third of the time.
The intensity of a storm is another matter all together. While progress has been made since 1990 on track forecasting, no progress has been made on how strong a storm will be. Experts tell me that 48 hours into a forecast the intensity of a hurricane could be off by as much as one category.
The problems forecasters face are 1) The evolution of large scale environments 2) Oceanic environment 3) Structure of cyclone's inner core 4) Physical processes within the storm - ie warming of the hurricane. Experts say they need to understand more the ocean's impact on the storm to better forecast it's intensity. They are working on this and will hopefully have more tools and better forecasts in the next few years.
2011 season forecast: The official outlook will be released in May from NHC. You can expect another above average season as has been typical over the last few years, what we will never know is where any one of them will make landfall.
Please stay tuned to WSVN, on air, on the web, or on your smart phone for the very latest. We will try our hardest to keep you up to the minute when any system threatens.
Friday, April 22, 2011

Monday, April 11, 2011
Will we ever get rain?
I have been receiving about 10-13 e-mails everyday regarding our dry conditions. They ask more or less the same things, why is it so dry? When will we see the rain return to South Florida.
Let's take the questions one at a time. Why is it so dry? We are in our dry season, which typically runs between November and May. No surprise here, but we aren't even receiving the small amounts we usually get. Miami is running about 9.5 inches below normal values, while Ft. Lauderdale is in the dry side almost 15 inches. (( NWS provided these numbers and they are from October 2010 through present. )) You can blame a host of things for this but primarily its been due to high pressure sitting over us for much of 2011.
High pressure is a huge mass of heavy dense air which tends to keep our atmosphere stable. Without any mixing, we don't get rain. So blame it on that.
Another factor contributing to the drought ,specially farther north ,is the low level of Lake Okeechobee. The depth right now is under 12 feet, what is average is around 14 feet. It is of concern, but the Lake is NOT our primary water source. We get our water from the Biscayne aquifer which sits directly below us. The Lake is low in part to Mother Nature and in part to it being drained by the Army Corp of Engineers. They have a list of reasons why, but that's for another post.
So now the last question...When will we see the rain return to South Florida? Typically the rainy season kicks off in the middle of May. The wind patterns change bringing in more heat and humidity leading to our run of the mill afternoon thunderstorms. This will help to bring our water levels back up. We will also get plenty of rain from the occasional tropical wave, and or, tropical system swinging though South Florida. Hopefully if we can get through the next 6-8 weeks, the rains should return.
Let's take the questions one at a time. Why is it so dry? We are in our dry season, which typically runs between November and May. No surprise here, but we aren't even receiving the small amounts we usually get. Miami is running about 9.5 inches below normal values, while Ft. Lauderdale is in the dry side almost 15 inches. (( NWS provided these numbers and they are from October 2010 through present. )) You can blame a host of things for this but primarily its been due to high pressure sitting over us for much of 2011.
High pressure is a huge mass of heavy dense air which tends to keep our atmosphere stable. Without any mixing, we don't get rain. So blame it on that.
Another factor contributing to the drought ,specially farther north ,is the low level of Lake Okeechobee. The depth right now is under 12 feet, what is average is around 14 feet. It is of concern, but the Lake is NOT our primary water source. We get our water from the Biscayne aquifer which sits directly below us. The Lake is low in part to Mother Nature and in part to it being drained by the Army Corp of Engineers. They have a list of reasons why, but that's for another post.
So now the last question...When will we see the rain return to South Florida? Typically the rainy season kicks off in the middle of May. The wind patterns change bringing in more heat and humidity leading to our run of the mill afternoon thunderstorms. This will help to bring our water levels back up. We will also get plenty of rain from the occasional tropical wave, and or, tropical system swinging though South Florida. Hopefully if we can get through the next 6-8 weeks, the rains should return.
Friday, April 8, 2011
Busy in the Weather Office
The next few months will be rather busy at the 7 Weather office as we approach the start of hurricane season 2011. We need to clean out our computers from all of last year's data, create new graphics for the upcoming season, and upgrade all the software.
So far, we have worked on a few folders and it feels like this is an insurmountable task, but WSVN has a great team of meteorologists who love what they do and always put in great effort to bring you the best hurricane coverage possible. So we'll be just fine.
One of the things we are working on, is adjusting the "Cone of concern" graphic. This will be the second year in a row that the National Hurricane Center narrows the dreaded swath. Every year the hurricane center improves on it's forecast accuracy and thus we adjust accordingly. It's not that difficult a process but time consuming, as we need to use some of last year's data to set the new parameters. (( Hope we haven't deleted it yet!!))
Other graphics we are preparing include, historical information, potential impacts to our area, storm names, storm surge threats and many more.
Already the team from CSU headed by Dr. Gray has released their projections for the season and NOAA will make public their forecast soon as well. No matter what the numbers say, just prepare as if we will get hit and you will survive whatever mother nature throws our way. These outlooks are just that, an outlook. We could end up with 17 storms in the Atlantic and if none make landfall we are all happy. Or it could be like Andrew... just one.... and it hit us.
Hurricane season runs from the first of June through the end of November and I encourage you to check here for my thoughts, worries, and concerns regarding storms in the tropics.
Hoping we don't see any again this year!
So far, we have worked on a few folders and it feels like this is an insurmountable task, but WSVN has a great team of meteorologists who love what they do and always put in great effort to bring you the best hurricane coverage possible. So we'll be just fine.
One of the things we are working on, is adjusting the "Cone of concern" graphic. This will be the second year in a row that the National Hurricane Center narrows the dreaded swath. Every year the hurricane center improves on it's forecast accuracy and thus we adjust accordingly. It's not that difficult a process but time consuming, as we need to use some of last year's data to set the new parameters. (( Hope we haven't deleted it yet!!))
Other graphics we are preparing include, historical information, potential impacts to our area, storm names, storm surge threats and many more.
Already the team from CSU headed by Dr. Gray has released their projections for the season and NOAA will make public their forecast soon as well. No matter what the numbers say, just prepare as if we will get hit and you will survive whatever mother nature throws our way. These outlooks are just that, an outlook. We could end up with 17 storms in the Atlantic and if none make landfall we are all happy. Or it could be like Andrew... just one.... and it hit us.
Hurricane season runs from the first of June through the end of November and I encourage you to check here for my thoughts, worries, and concerns regarding storms in the tropics.
Hoping we don't see any again this year!
Thursday, October 14, 2010
Sneak Peak
We dodged another bullet with "Paula" weakening and only impacting us slightly with some pockets of rain mainly across the Keys. Central and western Cuba received anywhere between 6-8 inches of rain with isolated spots reporting around 10. But all is not done.
It seems one model is hinting at another system brewing in the Caribbean over the next few days. It will develop in the Central Caribbean in about 120 hours and make a move towards Central Cuba. Let's see if this model pans out.
Check out the link below for the latest model run. Hit forward on the right side of the screen and wait until it runs through 120 hours of data.
http://moe.met.fsu.edu/cgi-bin/gfstc2.cgi?time=2010101412&field=Sea+Level+Pressure&hour=Animation
It seems one model is hinting at another system brewing in the Caribbean over the next few days. It will develop in the Central Caribbean in about 120 hours and make a move towards Central Cuba. Let's see if this model pans out.
Check out the link below for the latest model run. Hit forward on the right side of the screen and wait until it runs through 120 hours of data.
http://moe.met.fsu.edu/cgi-bin/gfstc2.cgi?time=2010101412&field=Sea+Level+Pressure&hour=Animation
Tuesday, October 12, 2010
Paula Power
It appears Paula may be one of the fastest growing storms on record reaching hurricane status in a mere 12 hours. The first advisory was issued on Monday at 5 pm and by Tuesday morning at 5 am it was upgraded to a Category one system. NHC began recording this type of data about 40 years ago and in all that time no system had grown this fast. The closest before was 18 hours with Hurricane Humberto in 2007.
I said it appears Paula managed this feat, that's because by the time the first advisory was issued, NHC had classified it as a tropical storm by-passing depression status all together. Maybe at the end of the hurricane season when NHC looks back at the data, they may include this extra time period and bump it from the top spot. If this happens, it will tie Humberto for fastest intensification.
The big question is where is it headed. Models all agree that a cold front will move into the Gulf over the next few days and push Paula East. Plenty of shear ahead of the front may weaken it as it moves towards Western Cuba.
Five days out models disagree as to what will happen, with some dipping Paula back South into the Western Caribbean, others push it across Cuba, while others take it to the Florida straits. Strength is also an issue. Models hint at a weaker system in 5 days, but it if sits over water for too long, it just may hold on to hurricane status.
Keep watching.
I said it appears Paula managed this feat, that's because by the time the first advisory was issued, NHC had classified it as a tropical storm by-passing depression status all together. Maybe at the end of the hurricane season when NHC looks back at the data, they may include this extra time period and bump it from the top spot. If this happens, it will tie Humberto for fastest intensification.
The big question is where is it headed. Models all agree that a cold front will move into the Gulf over the next few days and push Paula East. Plenty of shear ahead of the front may weaken it as it moves towards Western Cuba.
Five days out models disagree as to what will happen, with some dipping Paula back South into the Western Caribbean, others push it across Cuba, while others take it to the Florida straits. Strength is also an issue. Models hint at a weaker system in 5 days, but it if sits over water for too long, it just may hold on to hurricane status.
Keep watching.
Wednesday, October 6, 2010
Sub Tropical What?
A sub tropical system basically means we have a hybrid storm. It looks like a normal area of low pressure that moves throughout the natiion's midsection, but acts like a warm core tropical low. Its a category for those storms that quite don't fit the typical definition of a Tropical Cyclone.
Here's how NHC defines it:
A sub-tropical cyclone is a low-pressure system existing in the tropical or subtropical latitudes (anywhere from the equator to about 50°N) that has characteristics of both tropical cyclones and mid-latitude (or extratropical) cyclones. Therefore, many of these cyclones exist in a weak to moderate horizontal temperature gradient region (like mid-latitude cyclones), but also receive much of their energy from convective clouds (like tropical cyclones). Often, these storms have a radius of maximum winds which is farther out (on the order of 100-200 km [60-125 miles] from the center) than what is observed for purely "tropical" systems. Additionally, the maximum sustained winds for sub-tropical cyclones have not been observed to be stronger than about 33 m/s (64 kts, 74 mph)).
Many times these subtropical storms transform into true tropical cyclones. A recent example is the Atlantic basin's Hurricane Florence in November 1994 which began as a subtropical cyclone before becoming fully tropical. Note there has been at least one occurrence of tropical cyclones transforming into a subtropical storm (e.g. Atlantic basin storm 8 in 1973).
Subtropical cyclones in the Atlantic basin are classified by the maximum sustained surface winds:
less than 18 m/s (34 kts, 39 mph) - "subtropical depression",
greater than or equal to 18 m/s (34 kts, 39 mph) - "subtropical storm"
Prior to 2002 subtropical storms were not given names, but the Tropical Prediction Center issued forecasts and warnings on them similar to those for tropical cyclones. Since 2003 they are given names from the tropical cyclone list.
For more information see Penn State University's write up on the Subtropical Cyclones.
Here's how NHC defines it:
A sub-tropical cyclone is a low-pressure system existing in the tropical or subtropical latitudes (anywhere from the equator to about 50°N) that has characteristics of both tropical cyclones and mid-latitude (or extratropical) cyclones. Therefore, many of these cyclones exist in a weak to moderate horizontal temperature gradient region (like mid-latitude cyclones), but also receive much of their energy from convective clouds (like tropical cyclones). Often, these storms have a radius of maximum winds which is farther out (on the order of 100-200 km [60-125 miles] from the center) than what is observed for purely "tropical" systems. Additionally, the maximum sustained winds for sub-tropical cyclones have not been observed to be stronger than about 33 m/s (64 kts, 74 mph)).
Many times these subtropical storms transform into true tropical cyclones. A recent example is the Atlantic basin's Hurricane Florence in November 1994 which began as a subtropical cyclone before becoming fully tropical. Note there has been at least one occurrence of tropical cyclones transforming into a subtropical storm (e.g. Atlantic basin storm 8 in 1973).
Subtropical cyclones in the Atlantic basin are classified by the maximum sustained surface winds:
less than 18 m/s (34 kts, 39 mph) - "subtropical depression",
greater than or equal to 18 m/s (34 kts, 39 mph) - "subtropical storm"
Prior to 2002 subtropical storms were not given names, but the Tropical Prediction Center issued forecasts and warnings on them similar to those for tropical cyclones. Since 2003 they are given names from the tropical cyclone list.
For more information see Penn State University's write up on the Subtropical Cyclones.
Tuesday, September 28, 2010
Tropical Rain
As of Tuesday morning the area of disturbed weather in the Caribbean Sea has been classified as Tropical Depression 16. A recon plane will investigate the area later today. The models show it tracking towards us. The plane will get a better handle on its intensity and future growth. It appears that by this afternoon it will become a Tropical Storm.
As of 11 am, all of Southeast Florida is under a Tropical Storm watch.
The system will come for us. We won't have to chase it. It should track up the Florida Keys into Miami Dade, Broward, and exiting Palm Beach .
Models here: http://www.sfwmd.gov/portal/page/portal/xweb%20weather/hurricane%20model%20plots
This system has so much rain with it that South Florida could see a generous soaking starting this afternoon. Already we've seen isolated pockets of t-storms throughout the area. NWS has issued a Flood Watch for this afternoon. Between Tuesday and Wednesday we could see 4-8 inches of rain with pockets of more.
The Caribbean has become a tropical system nursery. Long range models show yet another disturbance brewing by Friday.
As of 11 am, all of Southeast Florida is under a Tropical Storm watch.
The system will come for us. We won't have to chase it. It should track up the Florida Keys into Miami Dade, Broward, and exiting Palm Beach .
Models here: http://www.sfwmd.gov/portal/page/portal/xweb%20weather/hurricane%20model%20plots
This system has so much rain with it that South Florida could see a generous soaking starting this afternoon. Already we've seen isolated pockets of t-storms throughout the area. NWS has issued a Flood Watch for this afternoon. Between Tuesday and Wednesday we could see 4-8 inches of rain with pockets of more.
The Caribbean has become a tropical system nursery. Long range models show yet another disturbance brewing by Friday.
Sunday, September 26, 2010
Yet another worry?
Ever since "Matthew" developed last week, most long range models were also suggesting another area of low pressure would develop in the Caribbean Sea. This is worrisome because the favored track for systems developing here is to move either straight towards Florida or move into the Gulf and then head to Florida.
Even if the steering winds keep it away from us, they could push the low across Central America causing large amounts of rain that could lead to devastating floods, land and mud slides.
As I have mentioned in the past, so far this year it appears that the CMC model has been performing the best. It too now shows something developing in the Caribbean Sea and aiming for us. Check out the link below for the latest CMC run. Once its loaded hit the forward button. It goes out 120 hours. It may take you a moment or two to see the swirl developing south of Cuba and then heading for the Sunshine State.
http://moe.met.fsu.edu/cgi-bin/cmctc2.cgi?time=2010092600&field=Sea+Level+Pressure&hour=Animation

NHC is now confirming the possibility of that happening. They are giving the area of clouds and rain sitting over the Western Caribbean Sea a 10% chance of becoming a depression in the next few days.
This would be a good time to check your preparedness plan just in case. If the CMC does pan out, we may be dealing with a system here towards the end of the incoming week. I hope it's wrong.
Even if the steering winds keep it away from us, they could push the low across Central America causing large amounts of rain that could lead to devastating floods, land and mud slides.
As I have mentioned in the past, so far this year it appears that the CMC model has been performing the best. It too now shows something developing in the Caribbean Sea and aiming for us. Check out the link below for the latest CMC run. Once its loaded hit the forward button. It goes out 120 hours. It may take you a moment or two to see the swirl developing south of Cuba and then heading for the Sunshine State.
http://moe.met.fsu.edu/cgi-bin/cmctc2.cgi?time=2010092600&field=Sea+Level+Pressure&hour=Animation

NHC is now confirming the possibility of that happening. They are giving the area of clouds and rain sitting over the Western Caribbean Sea a 10% chance of becoming a depression in the next few days.
This would be a good time to check your preparedness plan just in case. If the CMC does pan out, we may be dealing with a system here towards the end of the incoming week. I hope it's wrong.
Friday, September 24, 2010
"A low confidence forecast"
That is the sentiment coming from the National Hurricane Center on Friday morning regarding "Matthew". It appears the system has many factors influencing its future path, and to be quiet honest, the models don't have a good handle on them.
Let's focus on what we know: There is some light shear impacting Matthew and this should keep it in check for another 48 hours. High pressure to the north will push Matthew towards Central America until Sunday, after that, all bets are off.
The UKMET model pushes 'Matthew" into the Western Gulf of Mexico in about 5 days. If this happens, Matthew has to travel over allot of terrain that could significantly weaken it or dissipate it all together. Meanwhile the GFDL, HWRF, and GFS ensemble models turn it to the Eastern Gulf. In this scenario it will have a chance to grow stronger.
Why the discrepancies? Believe it or not, a Monsoon Low is developing over Central America that may drag Matthew into the Western Gulf. There is a front pushing out of Texas as well over the next few days that may shove Matthew to the Eastern Gulf. This is why the cone of uncertainty is so wide by the 5th day. It tries to compromise the wide array of tracks into one.
Worst case scenario for us would be a turn into the Eastern Gulf of Mexico which could potentially spell an impact for Florida by the end of next week.
In the words of the National Hurricane Center: "Significant changes (to the forecast cone) may be required later today" I'll keep you posted.
Let's focus on what we know: There is some light shear impacting Matthew and this should keep it in check for another 48 hours. High pressure to the north will push Matthew towards Central America until Sunday, after that, all bets are off.
The UKMET model pushes 'Matthew" into the Western Gulf of Mexico in about 5 days. If this happens, Matthew has to travel over allot of terrain that could significantly weaken it or dissipate it all together. Meanwhile the GFDL, HWRF, and GFS ensemble models turn it to the Eastern Gulf. In this scenario it will have a chance to grow stronger.
Why the discrepancies? Believe it or not, a Monsoon Low is developing over Central America that may drag Matthew into the Western Gulf. There is a front pushing out of Texas as well over the next few days that may shove Matthew to the Eastern Gulf. This is why the cone of uncertainty is so wide by the 5th day. It tries to compromise the wide array of tracks into one.
Worst case scenario for us would be a turn into the Eastern Gulf of Mexico which could potentially spell an impact for Florida by the end of next week.
In the words of the National Hurricane Center: "Significant changes (to the forecast cone) may be required later today" I'll keep you posted.
Monday, August 30, 2010
Hurricane Models like Athletes?
Many questions have arisen regarding the potential track of Earl and rightfully so. We all remember Hurricane Andrew with a similar track in 1992 and Hurricane Charlie in 2004. Charlie was expected to hit Tampa , but at the last minute changed course making landfall father South near Punta Gorda.
I have received countless e-mails, calls and texts regarding this question... "are you sure Earl wont hit us?" The truthful answer is no. Nothing is ever certain.
We rely heavily on highly complex and specialized computer models. Their forecasts are as good as the information given to them. Many, like athletes go on streaks. Some models will nail down every forecast one year, and fail miserably the next. Its up to us to figure out which one is at the top of its game. This year, in my opinion, it's the CMC.
I have been following the CMC model since the beginning of the hurricane season, and thus far, it is performing the best. Accurately forecasting all the tracks ( even the loop that TD 5 made over the Southeast ) and possible landfall sites.
It has been showing Earl getting pushed along to the west by the Bermuda high and then at the same time, a trough ( a weak front, accompanied by an elongated area of low pressure ) moving off the Atlantic seaboard. This traps Earl and sends it to the north becoming a worry for the middle Atlantic states down the road.
Check out the CMC model run on this link: http://moe.met.fsu.edu/cgi-bin/cmctc2.cgi?time=2010083000&field=Sea+Level+Pressure&hour=Animation
Everything in blue are areas of low pressure, in orange high pressure. You will find Earl as a tight circle east of Puerto Rico. On the right hand of the page (on some it may be way at the bottom) click on fwd and see the animation take Earl to the East Coast of the USA.
Because the CMC has been accurate so far, I feel confident in its track. Still, models like athletes, can have an unexpected injury or slump so keep monitoring is track just in case mother nature throws us a curve ball.
I have received countless e-mails, calls and texts regarding this question... "are you sure Earl wont hit us?" The truthful answer is no. Nothing is ever certain.
We rely heavily on highly complex and specialized computer models. Their forecasts are as good as the information given to them. Many, like athletes go on streaks. Some models will nail down every forecast one year, and fail miserably the next. Its up to us to figure out which one is at the top of its game. This year, in my opinion, it's the CMC.
I have been following the CMC model since the beginning of the hurricane season, and thus far, it is performing the best. Accurately forecasting all the tracks ( even the loop that TD 5 made over the Southeast ) and possible landfall sites.
It has been showing Earl getting pushed along to the west by the Bermuda high and then at the same time, a trough ( a weak front, accompanied by an elongated area of low pressure ) moving off the Atlantic seaboard. This traps Earl and sends it to the north becoming a worry for the middle Atlantic states down the road.
Check out the CMC model run on this link: http://moe.met.fsu.edu/cgi-bin/cmctc2.cgi?time=2010083000&field=Sea+Level+Pressure&hour=Animation
Everything in blue are areas of low pressure, in orange high pressure. You will find Earl as a tight circle east of Puerto Rico. On the right hand of the page (on some it may be way at the bottom) click on fwd and see the animation take Earl to the East Coast of the USA.
Because the CMC has been accurate so far, I feel confident in its track. Still, models like athletes, can have an unexpected injury or slump so keep monitoring is track just in case mother nature throws us a curve ball.
Thursday, August 19, 2010
Get a Grip!
NASA is really getting into hurricanes! Within the next few months they will deploy a handful of planes to study how hurricanes form and why they grow in strength so rapidly. The program is called GRIP. G for Genesis (relating to the beginning or birth of hurricanes) R for rapid, I-intensification and P for process.
The research will take place over the peak of hurricane season between August and September. It is hoped that the data will help forecasters determine the recipe for hurricanes, and that it will provide the keys for determining how and why they grow in strength.
The research will take months, but it will be worth it for all of us.
Link to the site below for a small video from NASA regarding GRIP.
http://www.nasa.gov/multimedia/videogallery/index.html?media_id=16340001
The research will take place over the peak of hurricane season between August and September. It is hoped that the data will help forecasters determine the recipe for hurricanes, and that it will provide the keys for determining how and why they grow in strength.
The research will take months, but it will be worth it for all of us.
Link to the site below for a small video from NASA regarding GRIP.
http://www.nasa.gov/multimedia/videogallery/index.html?media_id=16340001
Tuesday, August 17, 2010
Quiet Cape Verde, so far....
Hurricane season began June first and runs through the end of November. This of course is a man made timeline as storms can brew at any time of year as long as there is sufficient energy.
The primary source of fuel for hurricanes is warm ocean water of at least 80 degrees. Obviously the span from June through November is when the sea surface temps are the warmest and thus this is our hurricane season.

Hidden within this season is a smaller and more active grouping of months known as Cape Verde Season, usually kicking off around August and coming to an end by October. It is so called, because hot pockets of air come off the West Coast of Africa, move over the Cape Verde Islands, and then if the conditions are right, can grow into hurricanes. They move over the entire Atlantic picking up plenty of energy turning many of these Cape Verde Systems into monsters.
One great example was hurricane Andrew in 1992.
If we narrow our focus, we can see that activity picks up in August and reaches its peak in September. This search shows the amount of tropical systems sprouting between 1851 and 2009. In AUGUST there is a total of 352 systems while in SEPTEMBER it skyrockets to 540.
Experts are still predicting an active 2010 with around 20 tropical storms , above the seasonal average of 11. So far we've only seen Alex, Bonnie, and Colin. Up to this point it has been a rather dull and quiet season. Why? A few items come to mind. A strong Bermuda high, an expansive SAL or African dust plume in the atmosphere, and an unimpressive La Nina event.
Top scientist still warn that La Nina will rear its head soon making conditions better for hurricanes to grow, so we must remain vigilant. Some long range models, specifically the CMC has been on the mark this year forecasting activity and its calling for something to develop off the Cape Verde islands within the week. Hopefully it will be wrong. I would hate for our uneventful season so far, to come to an end.
The primary source of fuel for hurricanes is warm ocean water of at least 80 degrees. Obviously the span from June through November is when the sea surface temps are the warmest and thus this is our hurricane season.
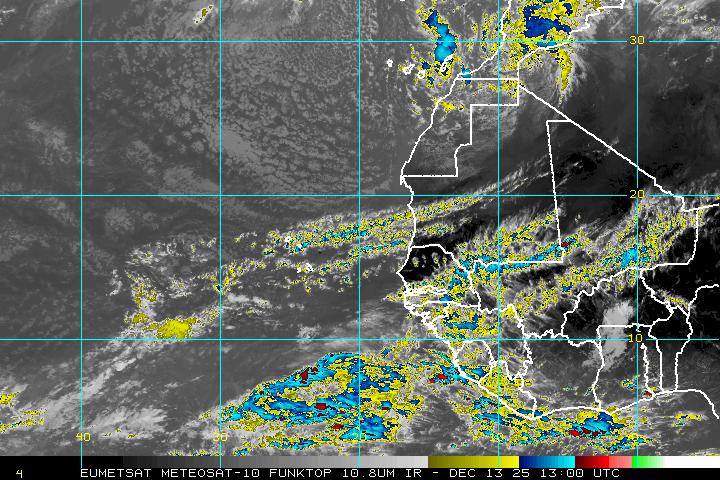
Hidden within this season is a smaller and more active grouping of months known as Cape Verde Season, usually kicking off around August and coming to an end by October. It is so called, because hot pockets of air come off the West Coast of Africa, move over the Cape Verde Islands, and then if the conditions are right, can grow into hurricanes. They move over the entire Atlantic picking up plenty of energy turning many of these Cape Verde Systems into monsters.
One great example was hurricane Andrew in 1992.
If we narrow our focus, we can see that activity picks up in August and reaches its peak in September. This search shows the amount of tropical systems sprouting between 1851 and 2009. In AUGUST there is a total of 352 systems while in SEPTEMBER it skyrockets to 540.
Experts are still predicting an active 2010 with around 20 tropical storms , above the seasonal average of 11. So far we've only seen Alex, Bonnie, and Colin. Up to this point it has been a rather dull and quiet season. Why? A few items come to mind. A strong Bermuda high, an expansive SAL or African dust plume in the atmosphere, and an unimpressive La Nina event.
Top scientist still warn that La Nina will rear its head soon making conditions better for hurricanes to grow, so we must remain vigilant. Some long range models, specifically the CMC has been on the mark this year forecasting activity and its calling for something to develop off the Cape Verde islands within the week. Hopefully it will be wrong. I would hate for our uneventful season so far, to come to an end.
Sunday, August 1, 2010
Why we should watch INVEST 91
A wave that came off Africa on Saturday has already developed a low pressure center of circulation. It appears it will not meet the same fate that a previous wave did on Saturday. Late last week a vigorous wave pushed into the eastern Atlantic, only to be choked by dry air, suffocated by African dust and squeezed by this new wave.
This new low , known as INVEST 91, will stay South of all that hostile activity steering over warm ocean waters with very little shear ahead of it. Most models intensify the low taking it near the Lesser Antilles as a Tropical Storm in 5 days. If it does grow into a storm, it will be called "Colin".
The models are pretty much in agreement over its future path, but not so much in its intensity. This worries me a little more than usual and here is the reason why. It may travel through the "Hebert Box". What in darnations is that?

This Box was named after Paul Hebert, once a director of the local National Weather Service office, and former forcaster for the National Hurricane Center. I was fortunate to be proctored by him during my early Weatherman days in the 19... lets say a while ago.
His research of past hurricane tracks lead him to a theory that says: Nearly every Major Hurricane that has hit South Florida since the start of the 20th century went through these boxes.

The boxes are located in the Atlantic and Caribbean. The first box is found east of Puerto Rico and the second box is located over the Cayman Islands. He adds that storms don't have to go through the boxes to hit us but if they do you have to watch out.
The pattern has proven accurate for 9 out of 10 storms that developed & hit Dade,Broward & Palm Bch Counties.

Now compare Box 1 with the latest model runs regarding INVEST 91... it just makes you wonder.
So what does this all mean? Right now nothing. But it is worth watching as INVEST 91 makes its way closer to the Hebert Boxes.
This new low , known as INVEST 91, will stay South of all that hostile activity steering over warm ocean waters with very little shear ahead of it. Most models intensify the low taking it near the Lesser Antilles as a Tropical Storm in 5 days. If it does grow into a storm, it will be called "Colin".
The models are pretty much in agreement over its future path, but not so much in its intensity. This worries me a little more than usual and here is the reason why. It may travel through the "Hebert Box". What in darnations is that?

This Box was named after Paul Hebert, once a director of the local National Weather Service office, and former forcaster for the National Hurricane Center. I was fortunate to be proctored by him during my early Weatherman days in the 19... lets say a while ago.
His research of past hurricane tracks lead him to a theory that says: Nearly every Major Hurricane that has hit South Florida since the start of the 20th century went through these boxes.

The boxes are located in the Atlantic and Caribbean. The first box is found east of Puerto Rico and the second box is located over the Cayman Islands. He adds that storms don't have to go through the boxes to hit us but if they do you have to watch out.
The pattern has proven accurate for 9 out of 10 storms that developed & hit Dade,Broward & Palm Bch Counties.
Now compare Box 1 with the latest model runs regarding INVEST 91... it just makes you wonder.
So what does this all mean? Right now nothing. But it is worth watching as INVEST 91 makes its way closer to the Hebert Boxes.
Subscribe to:
Posts (Atom)